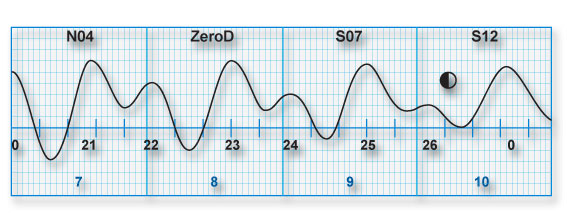
Legend of the tidal wave graphs.
================================================================
The tidal wave profiles were taken from those forecasted by the “Centro Maree del Comune di Venezia”. The times are u.t. + 1hr.
In a few points of the upper part of the graphs there is the approsimate declination of the moon at that moment.
On the lower part of the graphs, the numbers stand for the days of the month.
Either a <0> (zero), or the letter Z stands for the single tidal wave.
Example:
================================================================
index tides ||| © copyright notice