| Effect of sun storm on tides 2003-10 | ||
| During severe sun storm at the end of october 2003, extreme variation of sun wind speed, ranging 280-1200 km/s within 30 hrs, affects the times of the tides in Venice, at first by -170 mns, then by +190 mns. | ||
| Example of end october 2003. | ||
| .1 | An instance of anomaly of the first kind (tides either late or in advance), that I attribute to the solar wind conditions, was recorded at Venice, in 2003, between oct. 30th 18h00 UT and oct. 31 24h00 UT. | |
| .2 | Then, the two extreme conditions of the solar wind followed one another, one immediately after the other, and each one was maintained for enough time to possibly affect the times of the tidal waves; at first, by causing them to be in advance; soon afterwards, to be late. | |
| Hourly values of solar wind speed, starting 2003-10-30 h1800ut. From data by NOAA / SEC. | ||
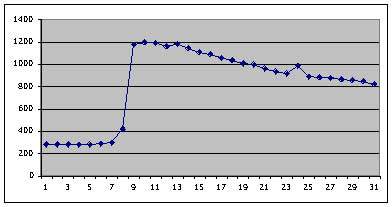 | ||
| Solar wind speed. | ||
| .3 | During the evening of october 30th, solar wind speed was at a very low level, between 280 and 295 km/s, well below the normal values of around 430. | |
| .4 | After midnight UT of october 30th the conditions changed dramatically. | |
| .5 | The solar wind reached and kept, almost for the whole october 31st unusual speed levels, above 850 km/s. For 7 hours, it even mantained a speed of over 1100 km/s. | |
| Tide times as forecasted, and as recorded. |
| all hours are UT | times of the tides as forecasted | water levels as recorded | time differences in minutes between the times predicted and times recorded |
| low water | 2003.10.30 - 19.00 | 2003.10.30 - 19.20 | - 40 |
| higher water | 2003.10.31 - 02.45 | 2003.10.30 - 23.50 | - 175 |
| low water | 2003.10.31 - 06.35 | 2003.10.31 - 04.40 | - 115 |
| higher water | 2003.10.31 - 11.50 | 2003.10.31 - 14.40 | + 170 |
| low water | 2003.10.31 - 20.20 | 2003.10.31 - 23.30 | + 190 |
| higher water | 2003.11.01 - 05.10 | 2003.11.01 - 07.40 | + 150 |
| low water | 2003.11.01 - 22.00 | 2003.11.01 - 23.15 | + 75 |
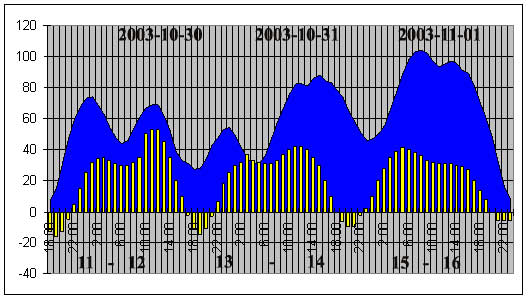 | ||
| Warning: one is advised not to be distracted by the dissimiralities in water levels, due to a low barometric pressure, which caused the water to be higher in the order of 15 to 20 cm (waves #11 and #12), and in the order of over cm 40 (waves #14, #15 and #16); instead on should consider just the differences in time patterns between what had been forecasted and the occurrences, and, moreover, the disposition of the two graphs in groups of two tidal waves. | ||
| Legend of the tidal wave graphs. | ||
| On the numbers of the tidal waves. | ||
| Remarks. | ||
| .6 | The tidal waves #13 and #14 were forecasted to merge (vertical bars). Instead, the wave #13 reached Venice well in advance; while the wave #14 was recorded exceptionally late. | |
| Attributions. | ||
| .7 | In no way, it was possible to explain such variation of the tides by attributing it to the weather conditions, which, in fact, were invaried. During the time span considered, from the level of 1001 mlb at 2003-10-30 h1900 UT, the barometric pressure decreased steadily, around 1 millibar every six hours, consistently, and always in the same sense. | |
| .8 | A sound method requires that all the occurences must be accounted for. If that is not possible, we must presume that something is still unknown. | |
| .9 | That's the reason I take into account also the situation of the solar wind. | |
| Delay between the solar wind conditions and its effects on the tidal waves. | ||
| .10 | The delays between conditions of the solar wind and its possible effects on the times of the tidal waves were of approximately ten hours, the same one which is normally recorded in Venice, between the passages of the spatioles and the arrival of the tidal waves. | |
| itineraries ||| © copyright notice |