2.3.6 - The water figures.
Water bumps have suggested to you that tides may be due to a decrease of the water density.
===============================================================
© copyright notice ||| français ||| italiano
prologue > index tides > 2.3 How this research on tides started.
2.3.0 - Title, subtitles, content, notice.
2.3.1 - Introduction to a research in its early days.
2.3.2 - Problems to be solved.
2.3.3 - A force not considered.
2.3.4 - The attention shifts to water.
2.3.5 - Hunting for discontinuous events.
>2.3.6 - The water figures.
2.3.7 - Problems of perception.
2.3.8 - Perspectives.
===============================================================
march 24, 2007.
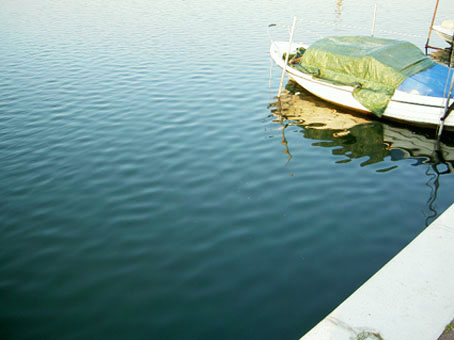
Two years after you started hunting for evidence, you saw these figures with the naked eye. It was March 24, 2007. What you had seen two years before were concave figures; they are rare, with very little statistical relevance.
You then thought that the swelling of the water figures could perhaps reveal the critical angular velocities of the Moon, those valid for water.
Only further research could confirm this your temporary assumption. It is not excluded that even a very large number of molecules, moving at the same critical angular velocity either relative to the Earth, or relative to the Moon, may cause the phenomenon. Without thereby revealing a precise critical velocity, one of those at which the Moon moves around the Earth.
Water figures with protuberances.
Since that March 24, you have stopped deleting the recordings to make room for others. You were no longer waiting for the concave figures. You understood that the protuberances were instead significant.
So you began to see in the past recordings many of these figures, which you had previously missed. Most had been done in 2006; one in 2005. The latter was saved because it was just before the end of a tape, which you had wanted to reuse. It may be unappealing, but it also helped you to suggest the hypothesis.
The thrust fronts.
The hypothesis that the tides are due to the cyclical decrease in water density is compatible with the following model: within each basin, a tidal wave would develop due to thrust fronts, generated by the pressure the water molecules - once they have decreased their density, and increased their volume - exercise on the neighbor ones. These, in turn, transmit the pressure to others in a chain, either until the impulses are exhausted, or until the advent of the next tide.
The speed of the thrust fronts varies in relation to the depth of the water, in the basin that you are going to consider. The greater the depth, the greater the speed of deployment of the tidal wave, and consequently also the extension of the relative basin that it forms.
In a small and shallow sea.
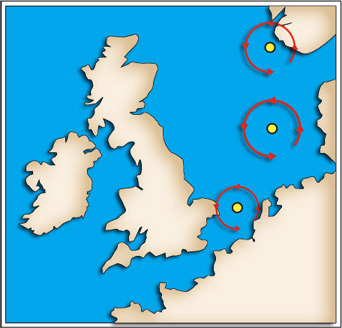
In the oceans.
If compared with the speed at which the Earth turns on itself, the speed of the thrust fronts is slow; this explains the number of basins, and their local character.
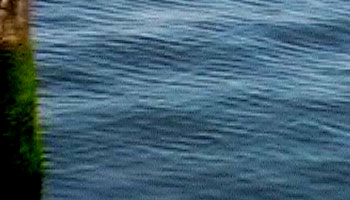
The hyper-amplified water figures.
The figures which are not much amplified are those you can now see with the naked eye. Instead, you are still not able to perceive the over-amplified ones. To your mind they still don't make sense. For the moment, you can see only those out of context, in photos or in videos [visible in itinerary 2.4].